The community forums and web pages for Blender are brimming with questions from new users. Many of them are the same question, or derivatives of the same question. The purpose of this chapter is to identify some of the most common ones and give you solutions to them so that you don’t have to dig through these websites (unless you really, really want to).
Blender’s Interface Is Weird or Glitchy
Blender uses OpenGL, an accelerated 3D programming library, for its entire interface. It’s not just used for the 3D Viewport, but everything in Blender uses OpenGL to draw to the screen, even text and buttons. Because of the extensive use of OpenGL, Blender often uses parts of the library that other programs may never touch. Depending what video card you have in your computer, the drivers for that card may not effectively implement these seldom-used library features that Blender needs. Granted, as Blender has modernized its core over the years (and dramatically so with the release of 2.80), glitches have been less common, but it does still happen.
On some machines, Blender may run very slowly, or you may see weird screen glitches around the mouse pointer or menus. The first thing to check is the drivers for your video card. Go to the website for the manufacturer of your video card to see whether any updates are available.
You may want to turn off any fancy effects that your operating system adds, such as transparent windows, shadows on the mouse cursor, or 3D desktop effects. Because all these little bits of eye candy tend to be hardware accelerated, they may be conflicting with Blender a bit. At the very least, turning them off usually makes your computer use fewer resources like processor power and memory, thereby making more of those resources available to Blender.
Failing those fixes, the only other remedy is to update the video card on your computer. If you have a large desktop box, you can probably get a nice replacement for whatever you have (speak with your local computer expert to make sure the card you buy will fit your gear). If you’re working from a laptop or a small-form-factor computer, then your only real option (short of getting a completely new computer) might be something called an eGPU, or an external video card. Many modern computers have a USB-C connector that supports a technology called Thunderbolt 3. If your computer has such a connector, you can purchase an external enclosure that connects to this port. In that enclosure, you can use nearly any video card you want (and for 3D work, I’d recommend you get as good as possible).
I Can’t Tell If I’m in Face Select Mode
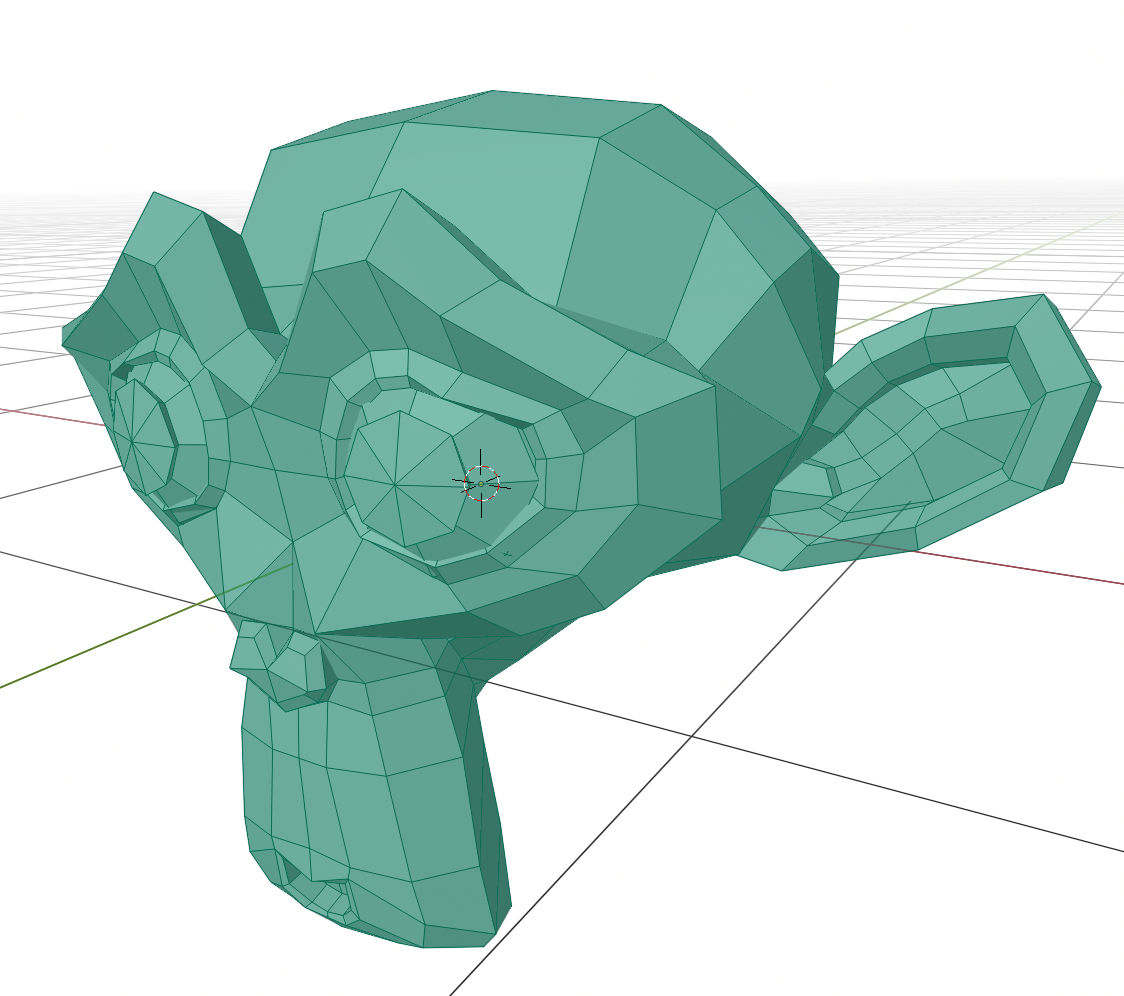
As you’re working on a mesh in Edit mode, the difference between Edge Select and Face Select can be pretty subtle. As shown in the following figure, it’s difficult to tell at a glance exactly which mode you’re currently in (especially on some custom themes).
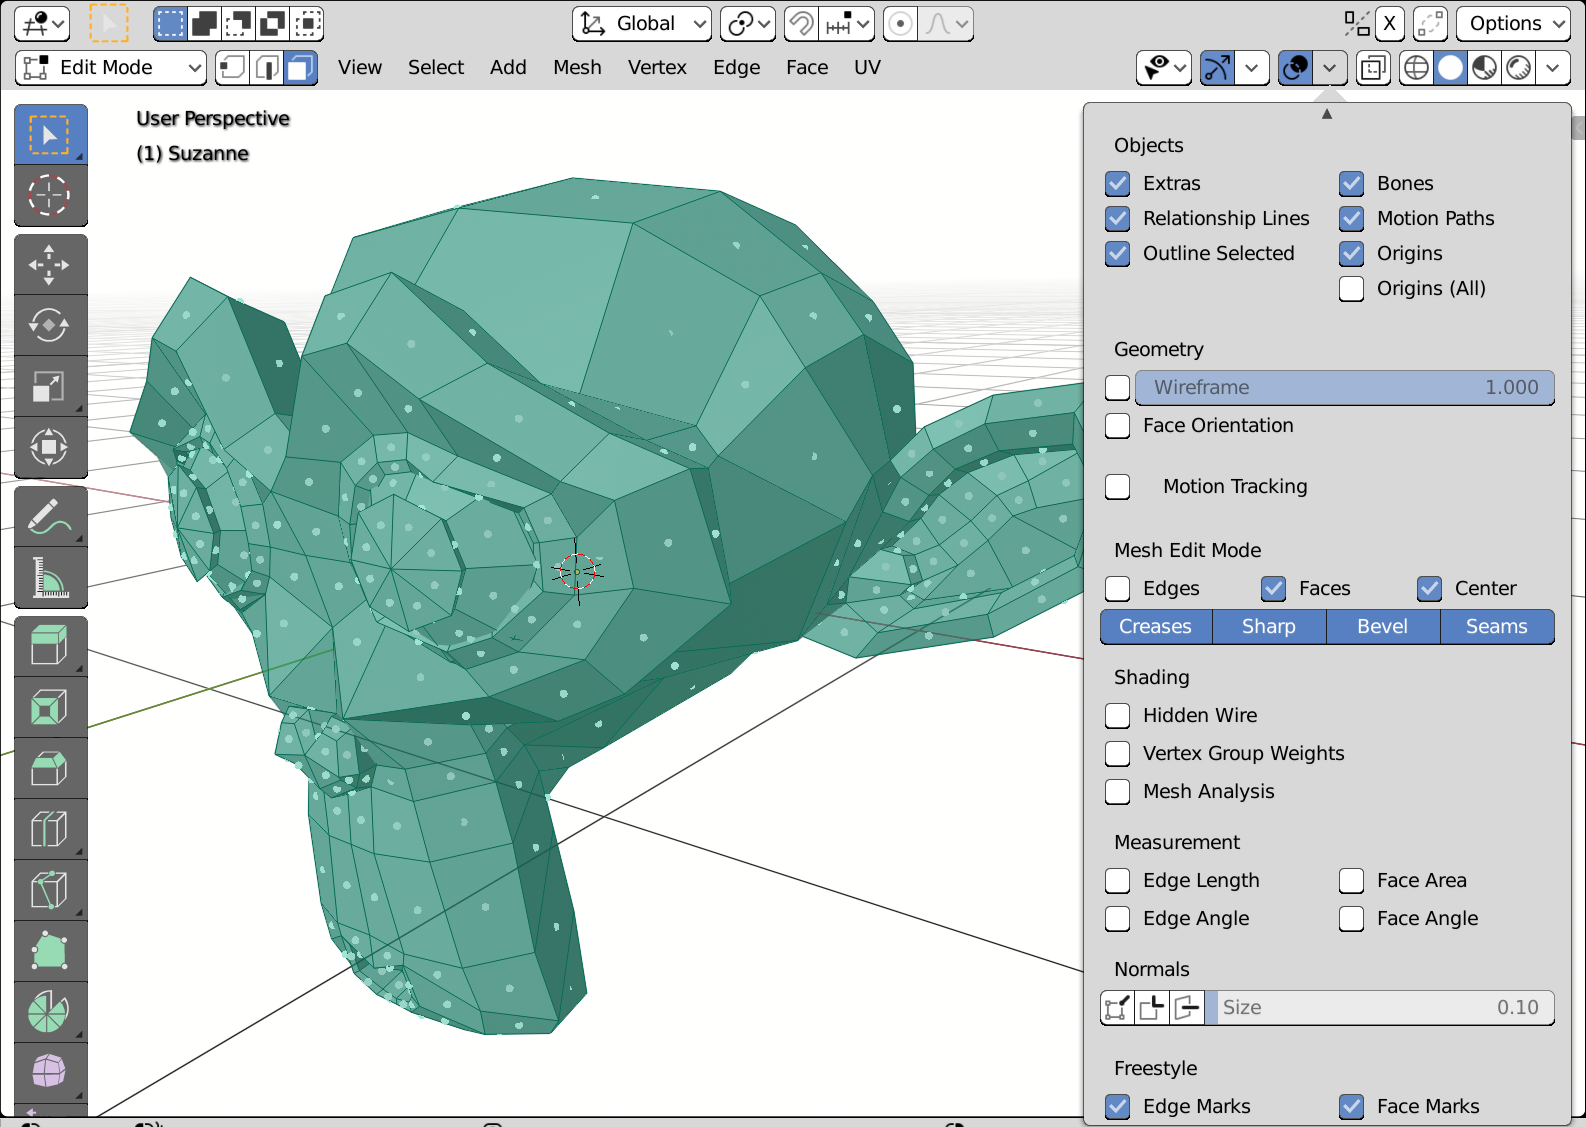
To make it much more clear which selection mode you’re using, you can activate a feature that was on all the time in older releases of Blender: face centers. Basically, when you’re in Face Select mode, Blender will draw a dot at the center of every polygon in your model. These face centers, or face dots as they’re more commonly called, not only provide a clear indication of which selection mode you’re using, but they also let you know where the geometric center of your faces are.
You enable face dots from the Viewport Overlays rollout in the 3D Viewport while you’re in Edit mode. About halfway down the rollout are a set of check boxes beneath the label Mesh Edit Mode. Toggle the Center check box and you get a nice dot at the center of every face in your mesh. The following figure shows the Viewport Overlays rollout and what a model in Face Select mode looks like with face dots turned on.
Objects Go Missing or Objects Are Rendering That Shouldn’t Be
Occasionally, you might run into a problem where not everything shows up in your 3D Viewport, even though you’re positive you didn’t delete anything. The first thing to do is to make sure that nothing is hidden. Pressing H in the 3D Viewport hides whatever you’ve selected, and it’s easy to accidentally hit it if you’re using a hotkey workflow and you’re actually trying to press G to grab an object. Fortunately, you can unhide all hidden objects quickly by pressing Alt+H. You can also look in the restrict column on the right side of the Outliner. If your object is hidden, the eye icon appears closed. Left-clicking the eye icon unhides it.
If you’re sure that nothing is hidden, next try to make all collections visible and check to be sure that you didn’t inadvertently move your object to a collection that’s hidden or deactivated in the Outliner. Collections can be hidden just like objects can. Furthermore, the check box to the left of the collection in the Outliner toggles whether that collection is included in your current View Layer.
One last thing to check is whether you’re in Local View, the view that isolates the few objects that you select and hides all the others from the 3D Viewport. The hotkey that toggles this view is Numpad Slash (/), and it can be pretty easy to accidentally hit it when using the numeric keypad to change views. One quick way to tell whether you’re in Local View is to look at the header for the 3D Viewport. In the upper left corner of the 3D Viewport, text tells you how you’re viewing your scene. If you’re in Local View, (Local) appears as the last part of that text. So, for example, it may say User Perspective (Local).
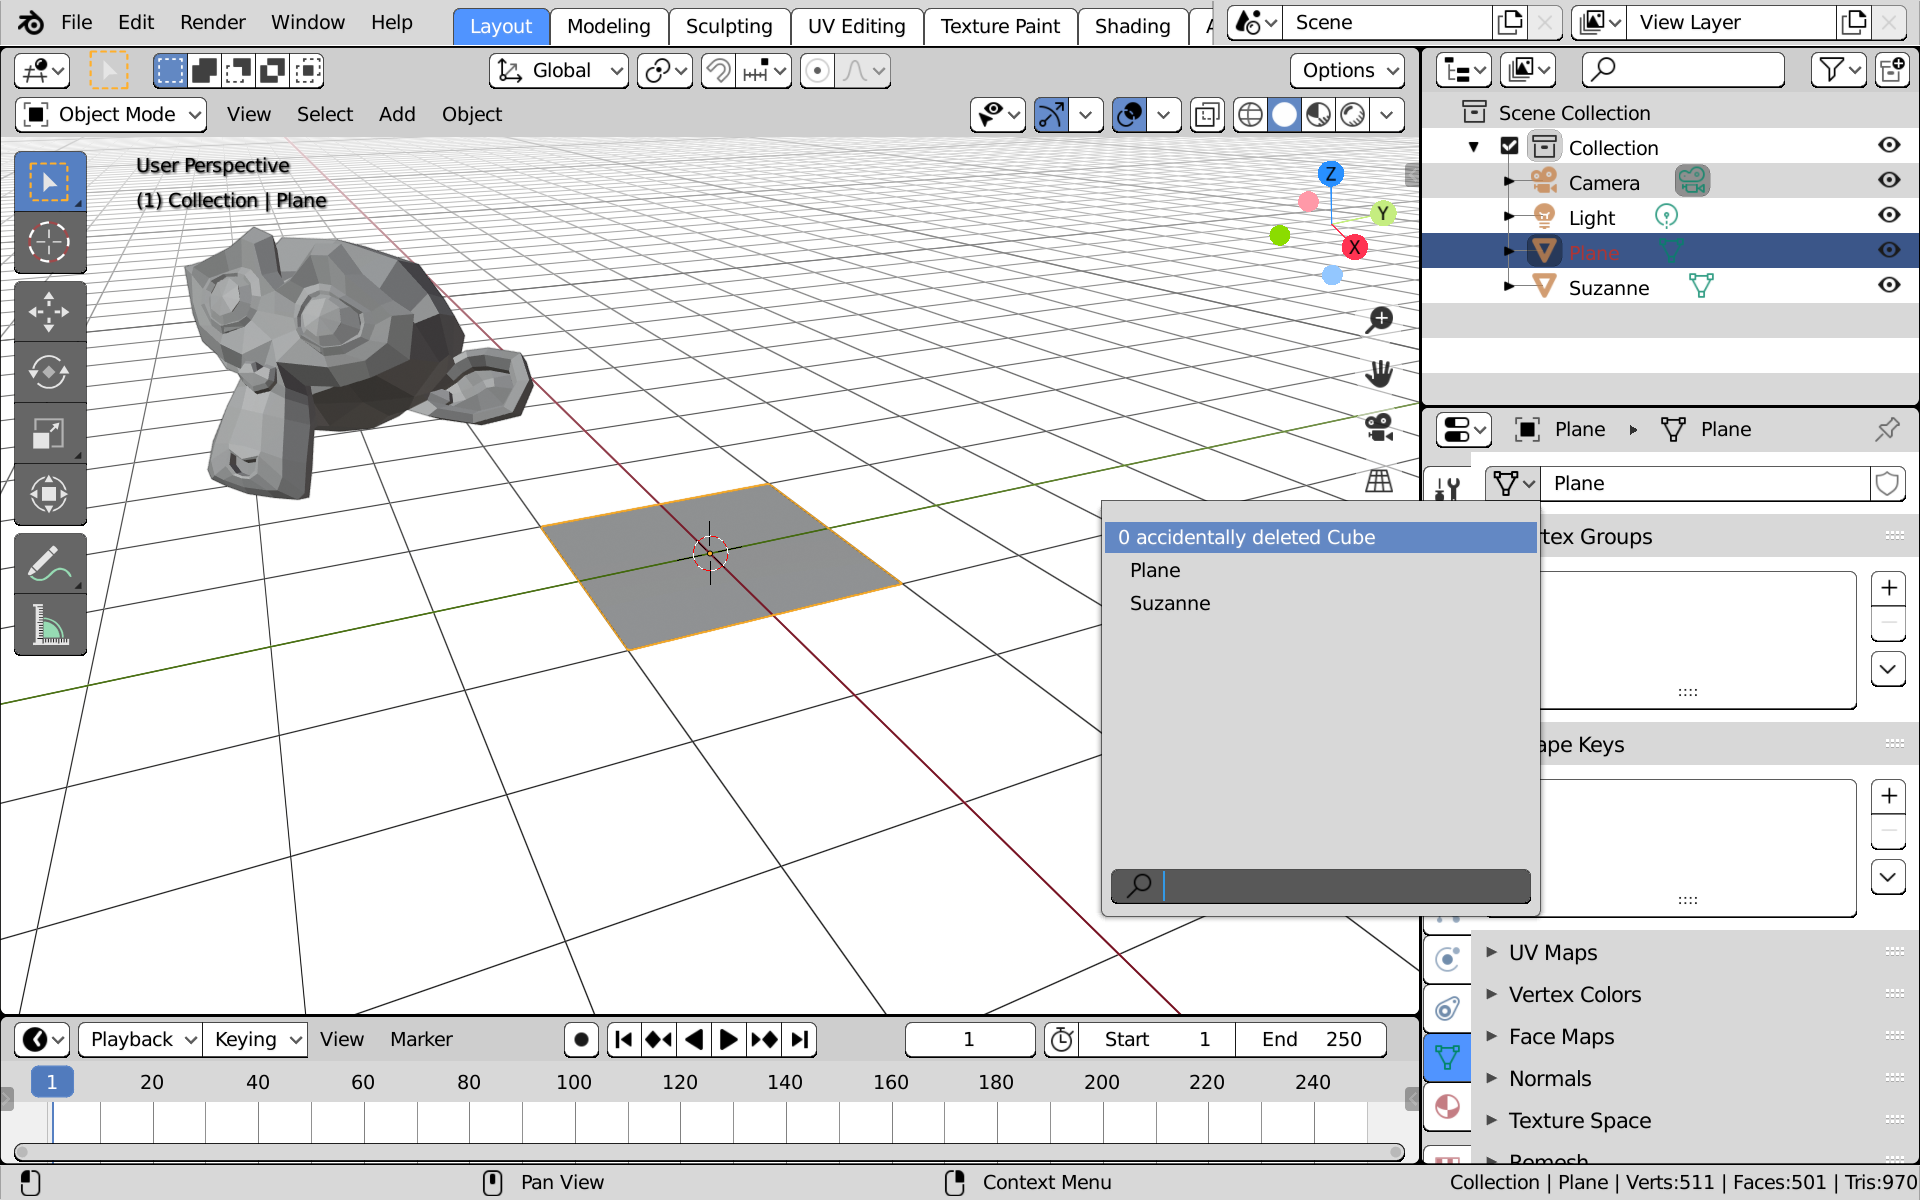
If none of these things work, there actually is the chance that you deleted your object by accident. Fortunately, if you haven’t closed your file, you can recover from this mistake as well. See, when you delete an object in Blender, its data doesn’t actually get completely deleted until you close the file or open a new file, so it still exists in Blender’s internal database for the file you’re actively working on.
I’m writing the next few steps under the assumption that your object was a mesh, but the same technique works for curves, text, and other types of objects. To recover a deleted object, use the following steps:
- Create a dummy object that’s the same type as the one you’re trying to recover.
For meshes, use any of the choices in Add→Mesh. - With your new mesh object selected, go to Object Data Properties and look at the top; in the Mesh datablock, left-click the button on the left side.
You see a list of all the objects in the scene that share the current selected object’s type. Anything you delete has an empty circle to the left of it. The next figure shows what this screen might look like. - If your deleted mesh data is in this list, select it and the dummy object you added in the first step is instantly replaced with the mesh for your deleted object.
Neat, huh?
Of course, you may find yourself in the opposite situation. You have an object in your scene that, for some reason or another, you just can’t seem to hide from rendering. The most likely cause of this is that you’re hiding your object only in the 3D Viewport. The H hotkey toggles visibility only in the 3D Viewport; it has no effect on whether that object is visible when rendering. You could get around this by throwing your object into a different collection and excluding that collection from your active view layer, but if you’ve already got your collections and view layers all meticulously set up, that can be really annoying to do. There’s an easier way.
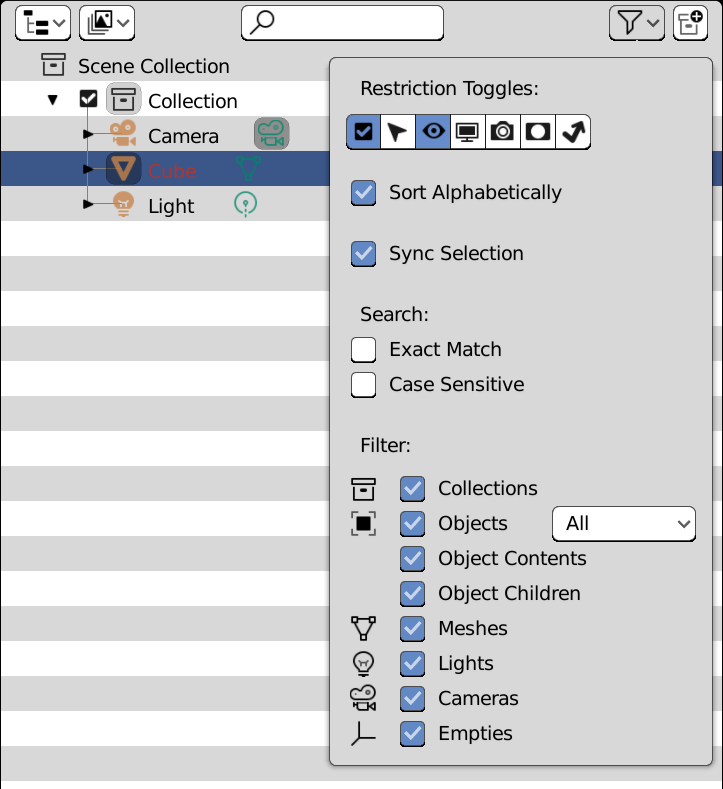
At the top right of the Outliner is a Filter rollout, indicated by an icon that looks like a funnel. Expand this rollout and you see something like what’s in the next figure. Across the top of this rollout are a set of Restriction toggles. By default, only the view layer exclusion and viewport hiding toggles are enabled. However, if you enable the render visibility toggle (it’s the icon that looks like a camera), you get an extra column of restriction controls along the right side of the Outliner where you can selectively enable and disable an object’s renderability by clicking the camera icon. You can even keyframe that property so it’s animated.
Edge Loop Select Doesn’t Work
The issue of Edge Loop Select not working happens the most on Linux machines. The Blender hotkey for doing a loop selection in Edit mode is Alt+left-click. Unfortunately, in Gnome and a few other window managers, this key sequence pops up a menu for controlling the window.
You can fix this issue in two ways. The easiest one is to use Shift+Alt+left-click. You typically use this combination to select multiple loops, but if nothing is selected, it works exactly the same as the Alt+left-click combination.
Of course, that’s a bit of a kludge. A better solution is to modify the window manager’s settings and bind the function that it ties to the Alt key to another key, like the infamous “super” or Windows key that most keyboards have. Because the method varies from one window manager to another, you’ll need to consult the documentation on your window manager to see the exact steps on how to do this.
Difficulty Being Stuck in Pose Mode
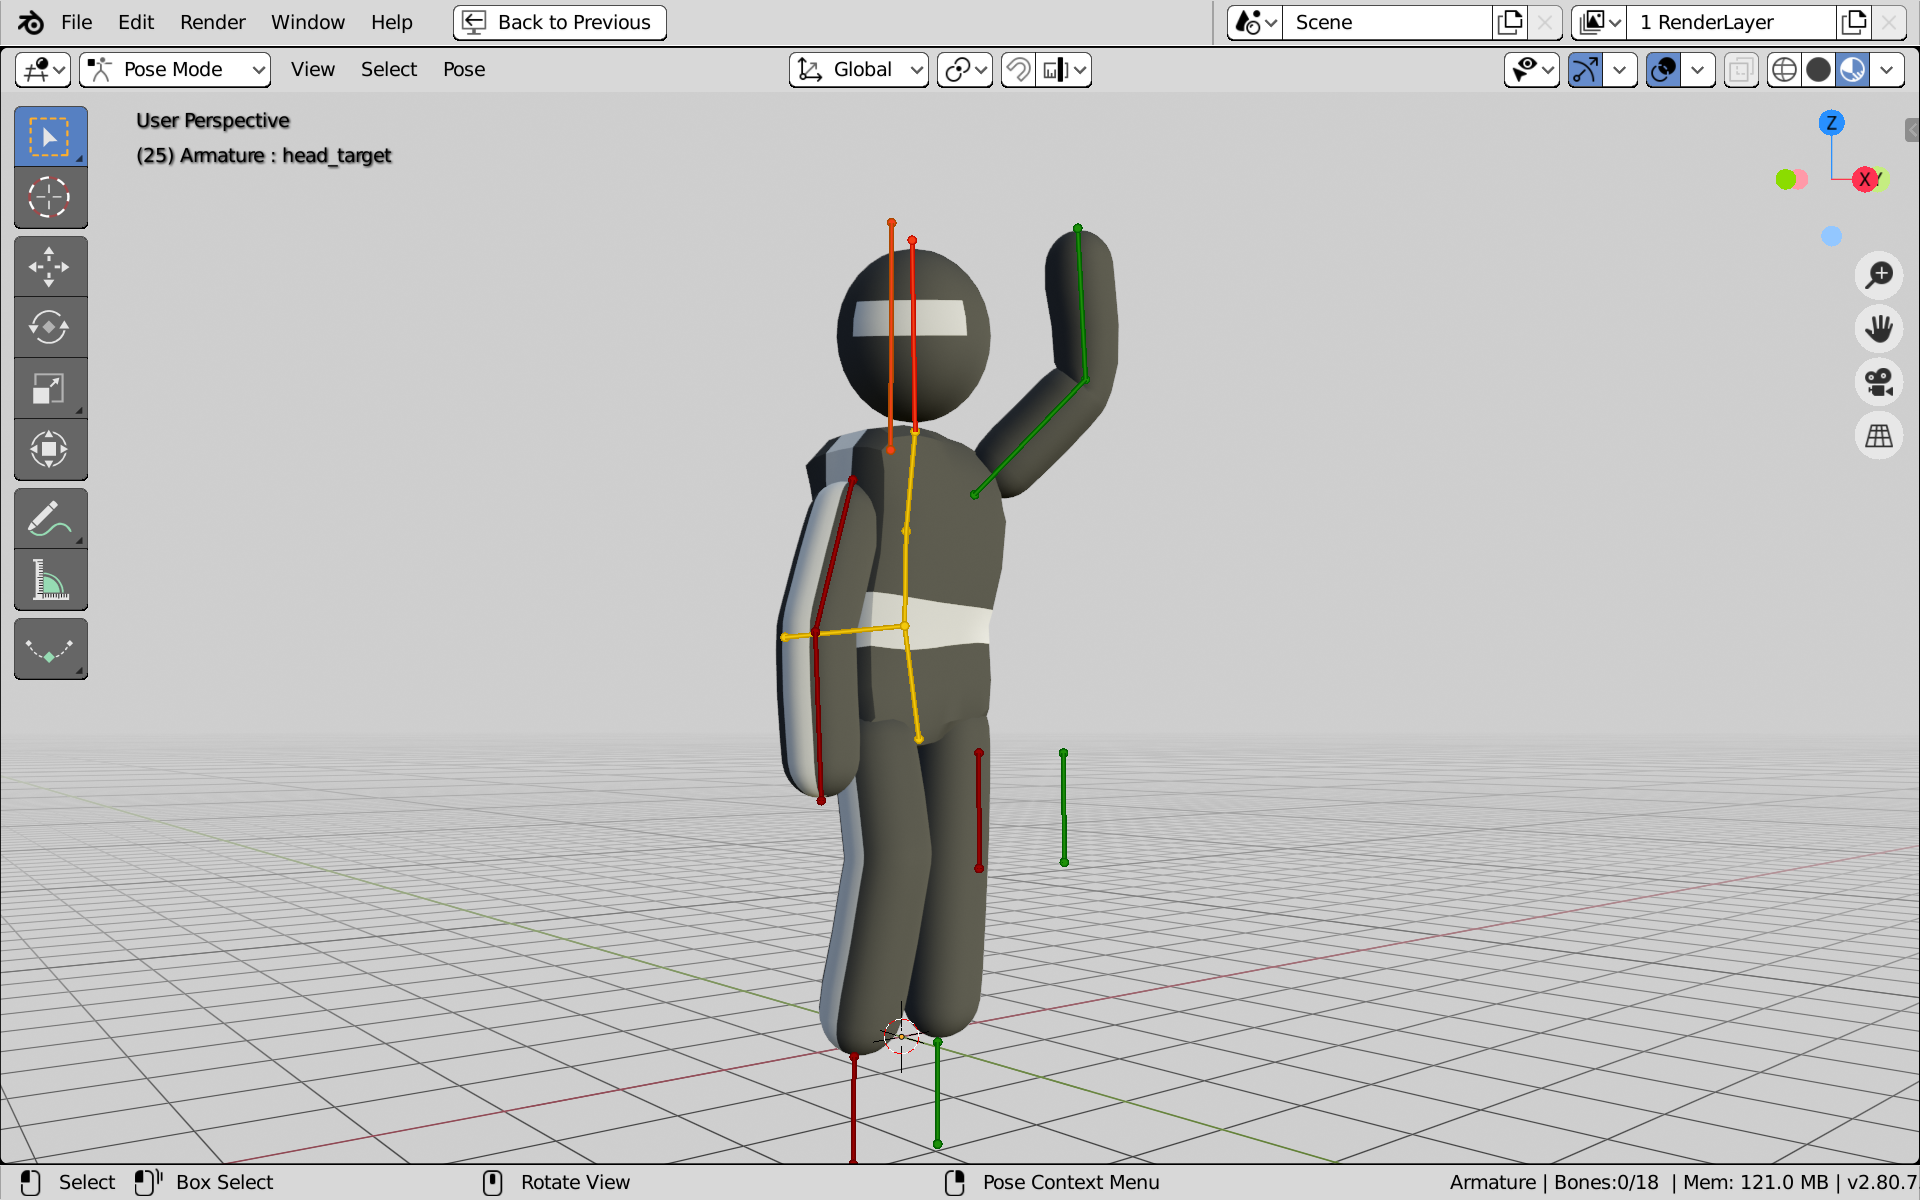
As you’re rigging or animating a character, you may try to select an object other than a bone of your rig and suddenly discover that you’re actually incapable of selecting that object in the 3D Viewport. Even if you try to get around that by selecting the object in the Outliner, your armature object remains selected and none of the transform tools seem to work.
This massive annoyance is caused by a feature called Lock Object Modes that can actually be helpful while animating, but can be infuriating and frustrating just about any other time. In essence, this feature prevents you from selecting other objects not currently in whatever mode your active object is. The feature is really useful when animating — especially so if you’re working with multiple armature objects — because it prevents you from accidentally selecting things that you don’t want to animate, much like the select restriction in the Outliner.
However, if you’re trying to quickly switch to an object that doesn’t have a Pose mode (basically any object that isn’t an armature), you’re blocked from doing that until you first switch back to Object mode. Not a huge deal, but stops like this can really ruin a flow when you’re deep into working on a rig or an animated sequence.
Fortunately, the fix is simple. Choose Edit→Lock Object Modes and toggle that feature off. After you do that, you’re free to leave your armature object in Pose mode while still freely selecting any other object in your scene.
Zooming Has Its Limits
When working in Perspective view, you may notice that occasionally you can’t zoom in on your scene as much as you’d like. This limitation is because you’re zooming toward a center point, and you’re very near it. You can take advantage of four workarounds:
- Place the 3D cursor at the location you’d like to zoom to and choose View→Align View→Center View to Cursor.
This workaround centers the view on the 3D cursor and gives you a clearer target to zoom in on. - Select the object (or sub-object element, like a vertex or edge in Edit mode) that you want to zoom in on and choose View→Frame Selected.
You can access this feature faster by using the Numpad Dot (.) hotkey or, if you don’t happen to have a numeric keypad, it’s available from the pie menu that appears when you press the Tilde (~) key. In there, it’s labeled as View Selected. Whichever way you access it, this workaround centers the view on your selection so you can now use that as your zoom target. - Try popping quickly into Orthographic view by pressing Numpad 5.
Because Orthographic view has no perspective distortion, the way it zooms is somewhat different, which may give you a better angle. A downside to this method is that you can’t get a view from inside your mesh, if that’s something you want. - Enable the Auto Depth check box in the Navigation section of Preferences (Edit→Preferences).
Enabling this option tells Blender to dynamically change the point you’re zooming in and avoids this zooming problem altogether.
Lost Simulation Data
As mentioned in Chapter 14, Blender saves some simulation data to your hard drive. Unfortunately, if that simulation data isn’t where Blender expects it to be, your simulation won’t show up in your .blend file and you may have to resimulate. Of course, because simulation can be very time consuming, you want to avoid resimulating whenever possible. So it’s in your best interest to try and track down that simulation data. Generally, lost simulation data happens for one of three reasons:
- You work on more than one computer.
If you work in Blender on more than one machine and only copy the.blendfile between the two, the simulation data isn’t where it needs to be on the second computer. You need to copy that simulation data to the same place relative to your.blendfile on the second computer for it to show up properly. - You accidentally changed or deleted the path to the simulation data.
This reason isn’t common, but it does happen. Fortunately, the fix is simple for fluid simulations. Select the domain object for your fluid simulation and go to the Physics tab of the Properties editor. In the Bake panel, the path to your simulation data is right there. Enter the proper path or left-click the folder icon to the right of the field and find the proper directory with the File Browser. - You’re using the
/tmpdirectory for your simulations.
Initially, using/tmpdoesn’t seem like that big of a deal. However, on some operating systems, the/tmpdirectory is periodically purged, deleting everything in it. If that directory gets purged, your simulation won’t show up and your only option is to rebake it.
Using/tmpall the time also has another nasty side effect: Different .blend files overwrite the simulation data that’s in there. So you may run into a situation where you open one.blendwith a fluid simulation only to see the simulation results from another file. Again, the only solution in this case is to rebake your simulation. This time, however, set the path somewhere else so this doesn’t happen again.
Objects Don’t Appear When Rendering
Sometimes, when you render, you might notice that some objects are perfectly visible in the 3D Viewport, but they don’t show up in your render. There are a few reasons that this may happen:
- Camera clipping: Just like with the shadows of Spot light objects in Eevee, as described in Chapter 10, cameras have a clipping distance (a range of visible area with a start and an end). The default clipping distance for looking around the 3D Viewport without a camera goes from 0.1 meters to 1000 meters. However, the default camera object has a clipping distance only from 0.1 meters to 100 meters. This means that an object that’s 101 meters away from your camera object will show up in the 3D Viewport, but it may not appear when you render.
The fix for this is to either change the position of the object that’s too far away, or increase the end clipping distance for your camera object). For the latter, select your camera object and go to Object Data Properties and adjust the Clip Start and End properties in the Lens panel. - Restricted rendering: Blender’s Outliner gives you the ability to restrict (disable) rendering for specific objects, as covered earlier in this chapter. Although this feature can be useful for animation purposes, it isn’t difficult to forget that you’ve made that toggle.
Fortunately, the fix is easy. Go to the Outliner, find your object, and re-enable renderability on it by left-clicking the the icon that looks like a camera. If you don’t see that icon, you may need to make it visible in the Outliner as described earlier in this article in the section entitled “Objects Go Missing or Objects Are Rendering That Shouldn’t Be.” - Non-rendered layers: View layers are an incredibly powerful tool for compositing. However, with that power comes the need to be more fastidious in how you manage your scene. It’s very possible to disable a collection from being used in a view layer. The result is the functional equivalent of enabling restricted rendering on every object in that scene layer.
To fix this issue, use the View Layers datablock at the top right corner of the Blender window to go through each of your view layers. As you do, look in the Outliner (make sure its Display mode is set to View Layer) and double-check the collections that you have assigned to each view layer. If you know which collections an object is in, you should be able to ensure those collections are enabled.
No GPU Rendering for Cycles
One of the biggest appeals for using Cycles as a renderer is its ability to leverage your video card’s GPU to speed up calculations (and, by extension, the overall rendering process). Unfortunately, depending on your computer hardware, you may not be able to take advantage of this speed boost.
The first thing to check is whether you’re currently using GPU computing at all. If you’re using Cycles (by picking Cycles from the Render Engine drop-down menu in Render Properties), look at the top of Render Properties. There should be a drop-down menu there labeled Device and it should be set to GPU Compute. If it’s set to CPU or that drop-down menu isn’t there, that’s the first sign that you aren’t using your GPU for rendering with Cycles.
Your next step is to look at the System section of Preferences (Edit→Preferences). At the top of the section is a little section labeled Cycles Render Devices. The first set of radio buttons beneath that should give you the options of None, CUDA, or OpenCL. If your video card supports it, you want to pick CUDA or OpenCL. CUDA is a GPU computing technology developed by NVIDIA to run on their cards, whereas OpenCL is an open GPU compute platform used by other cards. Cycles can use either technology for GPU computing features. Once you pick either CUDA or OpenCL, you should be able to pick your specific video card from the drop-down menu below those radio buttons. If you don’t have any video cards with GPU compute capabilities, Blender will kindly let you know this as well.
If Blender doesn’t think you have video cards capable of doing GPU computation, you may be in one of small handful of scenarios:
- You don’t have a video card capable of doing GPU compute.
If this is the case, your only options are to either stick with CPU-only rendering, get a new video card, or use a render farm service. - You have a video card with GPU compute, but its CUDA or OpenCL support is too old.
Again, your only options in this case are to stick with CPU rendering, upgrade your video card, or use a render farm service. - You have a GPU-compute-capable video card, but you haven’t fully installed drivers and/or CUDA support.
Consult the documentation for your specific operating system on how to properly update your drivers and enable CUDA or OpenCL support. After you do that (and go through the start/restart ceremonies that your operating system requires), you should be able to fire up Blender and enable GPU-accelerated rendering in Cycles.
Funky Deformations in Animation Rigs
This isn’t necessarily specific to animation rigs, but animation rigs are where you most often see it. The effect is easy to recognize. For example, say you have a mesh set up to be controlled by an armature. However, when you move or rotate any of the bones, the mesh stretches, skews, and scales wildly, like it isn’t even really being controlled by the armature at all.
A few different things may cause this behavior, and it may happen any time you add a deforming modifier (such as Armature, Curve, Lattice, or Mesh Deform) or nearly any constraint to an object. If this is happening to you, check for these red flags:
- Non-applied transformations: It’s possible that you moved, rotated, or scaled your mesh (or worse, your armature) in Object mode prior to adding the modifier or constraint. This might not seem like a big deal, but the problem is that modifiers and constraints tend to operate on the original data (the Edit mode data). If you change the location, orientation, or size of that data in Object mode, the modifier or constraint doesn’t have a valid frame of reference.
The remedy for this is to apply your transforms (Object→Apply→All Transforms) or back them out — particularly scale and rotation — to base values (1,1,1 for scale and 0,0,0 for rotation). - Doubled-up modifiers: You can run into this problem with the Armature modifier in particular. It sometimes occurs when you use the parenting shortcut for adding an Armature modifier to a mesh (Ctrl+P→Armature Deform). If you aren’t careful, you could be adding multiple Armature modifiers, each one adding to the influence of the previous one. This results in an effect where you rotate a bone and the mesh ends up moving twice as far as it should.
Fortunately, the fix for this is easy. Check the Modifier tab of the Properties editor and make sure you haven’t doubled up. - Cyclic dependencies: This one is probably the most difficult to track down. For example, you may have a situation where a bone in your armature is influencing the location of a hook that, in turn, is the parent of the armature object. Cyclic dependencies like this one can be very difficult to track down, but they’re a sure way for a rig to go haywire in all kinds of interesting ways. Blender does its best to advise you of potential cycles by printing warnings to the system console (this is why it’s wise to rig with a version of Blender that’s launched from the terminal, or choose Window→System Console), but it currently can’t catch everything.
A good test for cyclic dependencies is to grab a control and move it around, then cancel that operation (Esc). If you have a cyclic dependency, not everything will snap back to its previous position. If you see this happening in a rig of yours, you’ll need to sit down and meticulously work your way through the rig to suss out the source of the problem.
Latest Posts
Stickman!

Baking Texture Maps from Your Mesh